Stay Ahead of the Rush: Proactive Congestion Forecasting with TWAMP

The demands on our data networks have never been higher. Video streaming overloads both fixed and mobile networks with data, and micro-bursts originating from streaming video destroy the performance of applications requiring low latency and high quality and performance, such as cloud gaming, video conferencing, voice, or machine-to-machine communication. The download speeds to mobile devices have increased by a factor of ten with the introduction of 5G, causing even more aggressive microbursts on the mobile networks, and services like Fixed Wireless Access (FWA) can increase the traffic demands by as much as 15-20 times compared to a traditional mobile connection. Further, ultra-high-definition streaming on fixed networks can increase traffic demands 3-5 times. This relentless growth in traffic volume, speed, and diversity puts immense strain on both fixed and mobile network infrastructure, making traffic congestion a considerable threat to user experience.
Traditionally, network management in both fixed and mobile domains has often been reactive. Alarms trigger when performance metrics cross critical thresholds, engineers scramble to diagnose the root cause, and solutions are implemented after users have already experienced slowdowns, buffering, or dropped connections. In today’s hyper-connected world, where seamless performance is expected, this reactive approach is no longer sufficient. Waiting for problems to manifest leads to customer frustration, churn, and operational inefficiencies. The key is to shift towards proactive network management – predicting and preventing issues before they impact subscribers.
Enter TWAMP: Your Active Insight into Network Health
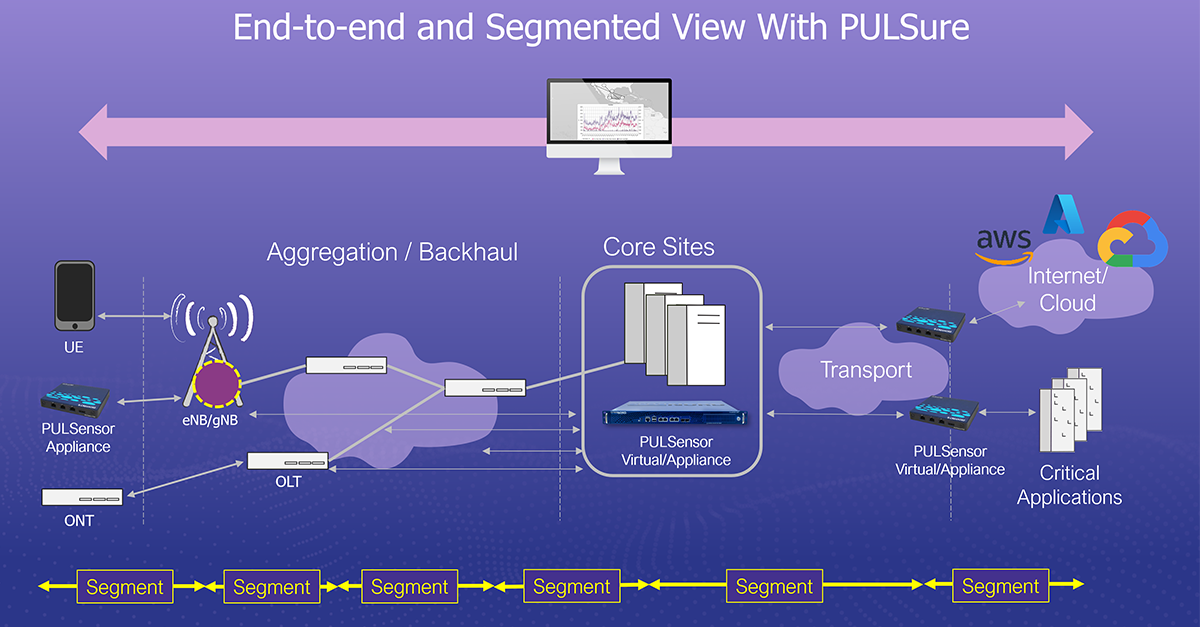
The Two-Way Active Measurement Protocol (TWAMP), standardized by the IETF, offers a versatile and powerful tool for gaining real-time, actionable insights into network performance across any IP-based network. Unlike passive monitoring, which analyzes existing user traffic, TWAMP actively sends lightweight test packets between two defined points. All the major vendors support the TWAMP protocol, and hence you can deploy a specialized probe in a central location of the network and use the TWAMP reflector capability available in most of the devices in the network to form a multi-vendor, end-to-end view of your network performance for your data layer.
By precisely measuring the round-trip time, delay variation (jitter), and packet loss of these dedicated test packets, TWAMP provides a clear, continuous view of the conditions across specific network paths, independent of actual user traffic fluctuations at that exact moment.
 Understand TWAMP Protocol better, read this article:
From KPIs to Forecasts: Leveraging TWAMP Data
The strength of TWAMP lies in the consistent, granular data it provides, which directly translates to network health indicators applicable to both fixed and mobile environments:
- Rising Latency: As network paths become more utilized (whether in a metro Ethernet ring or a mobile backhaul link), packets spend longer in queues, increasing round-trip times. A sustained increase in latency is an indicator of growing load.
- Increased Jitter: Higher variation in packet arrival times (jitter) indicates inconsistent queuing delays. This is detrimental to real-time applications like VoIP, video conferencing, and online gaming, which are common across both fixed and mobile connections, and often precedes more severe congestion.
- Packet Loss: When a router or switch buffers overflow due to excessive traffic, packets are dropped. Even low levels of packet loss, especially if trending upwards, clearly indicate impending or existing congestion, impacting everything from file downloads to streaming quality.
By continuously collecting and analyzing these TWAMP KPIs over time, operators can move beyond simple threshold alarms. Trend analysis reveals gradual degradation patterns, enabling network teams to forecast when and where congestion is likely to become problematic before it significantly impacts end-users.
All you need to know about latency here:
Unmasking Microbursts: A Critical Clue for Capacity Planning
A significant challenge common to both high-speed fixed and advanced mobile networks is dealing with microbursts. These are extremely short, intense bursts of traffic that can overwhelm network buffers in milliseconds. They cause packet loss and jitter spikes that degrade application performance, even if the average utilization measured over seconds or minutes appears perfectly healthy. Passive monitoring often misses these fleeting, yet impactful, events.
TWAMP’s ability to send test packets frequently (typically at 10 packets per second or sometimes even 100 packets per second) makes it adept at capturing the effects of microbursts. The momentary spikes in latency, jitter, and loss measured by TWAMP act as a signature for these events. Identifying the frequency and severity of microbursts on specific network segments provides invaluable information:
- Early Warning System: Frequent microbursts, whether on a link to a large enterprise customer or in the mobile transport network, indicate that while average load might be manageable, the peak capacity is being stressed.
- Targeted Capacity Planning: Knowing which fixed or mobile network paths experience regular microbursts allows operators to proactively increase capacity, adjust traffic shaping, or implement Quality of Service (QoS) enhancements precisely where needed. This enables forecasting based on peak demands, leading to more efficient infrastructure investment.
More on micro-burst challenge and battling it:
Proactive Network Management with TWAMP: Taming the Micro-burst Monster
The Proactive Advantage
Implementing a congestion forecasting system based on active TWAMP data provides a unified, proactive approach for diverse network environments:
- Multi-Vendor End-to-End Continuous Monitoring: Deploy TWAMP sessions across the critical fixed and mobile network paths by deploying specialized probes in a few central locations and using the in-built TWAMP reflectors in the devices in the network to reflect the packets back.
- Deploy a central TWAMP collection server that collects all the monitored data and runs analytics on the data to analyze trends over various time scales.
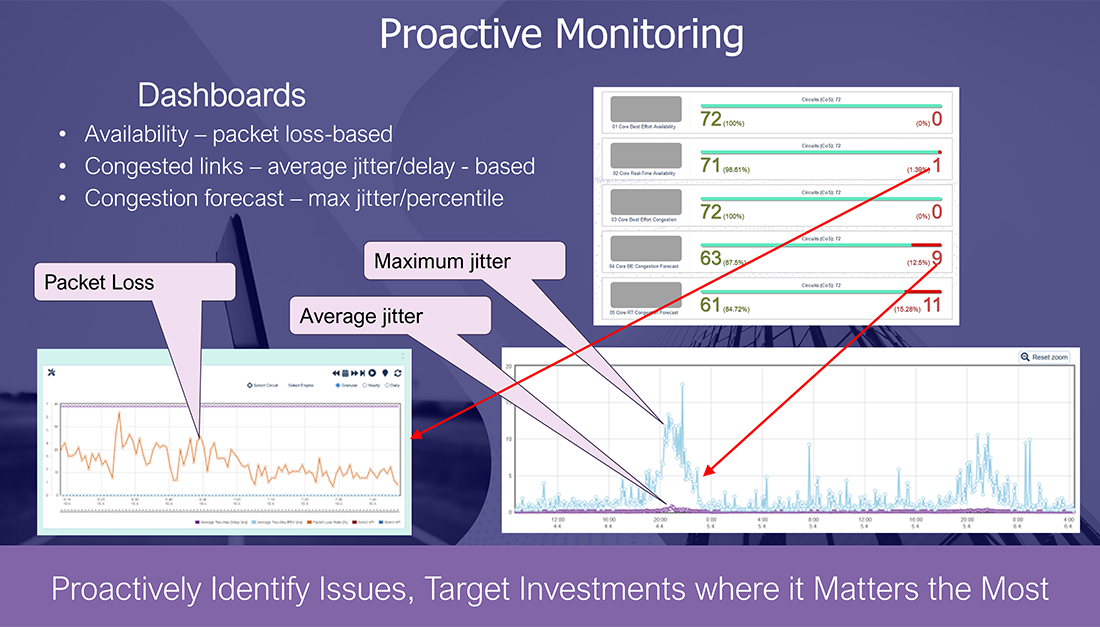
- Microburst Detection: Identify sharp, transient KPI spikes indicative of microburst, looking at maximum KPIs or percentiles.
- Dashboarding: Build dashboards that summarize the data from the entire network into easy and actionable data. Availability dashboards based on packet loss to identify the worst-performing links in the network. Congested links dashboards to find the currently most congested links. Congestion forecast dashboards that identify the links that will likely become congested in the near future.
- From Reactive to Predictive Forecasting: Focus first on the availability and congested links dashboards to sort out your current issues in the network. As the network improves, pay more attention to your congestion forecast dashboards to anticipate issues ahead of time.
- Preventative Action: Based on the forecast dashboards, proactively manage resources – reroute traffic, adjust QoS, schedule bandwidth upgrades, or optimize routing across the infrastructure before user experience is compromised.
Deploy Active TWAMP Monitoring effectively! Learn how to do it here:
An Introduction to Using the TWAMP Protocol for Active Monitoring of 5G Transport Networks
Conclusion
In an era defined by soaring bandwidth demands and low-latency applications across both fixed and mobile platforms, passively waiting for network congestion is untenable. By embracing active measurements with TWAMP, network operators gain the crucial visibility needed to understand real-time conditions, detect challenging phenomena like microbursts, and accurately forecast impending congestion across their entire infrastructure. This shift to proactive, data-driven network management is essential for optimizing resource utilization, ensuring network reliability, and delivering the high-quality, consistent experience that today’s digital consumers and businesses expect.
Get on top of your network monitoring