The Value of TWAMP Monitoring – Typical Findings in Live Networks

In an earlier blog, we introduced the Two-Way Active Measurement Protocol (TWAMP) for active performance monitoring of 5G transport networks, looked at why active monitoring is needed, and described the main benefits of deploying a centralized active monitoring solution. In this blog, we will look at some concrete findings that we have found in live networks with our customers to further highlight the benefits of using the TWAMP protocol to build outperforming networks.
In today’s competitive telco landscape, providing a high-quality network with excellent user experience is key. There are studies that show that the network is the top buying factor for 40% of the users. The same studies show that nearly 40% of the users switch operators because of network quality issues. At the same time, there is more business and mission-critical traffic on the networks demanding excellent network performance at all times.
TWAMP was designed to meet the requirements of end-to-end active performance monitoring for the data applications of today and tomorrow with sufficient granularity and accuracy to measure the smallest microbursts at microsecond-level accuracies. One of the greatest benefits with TWAMP is that it is a mature standard with more than 15 years of age resulting in robust implementations and wide support from all of the major network element vendors. Thus, by implementing a centralized TWAMP monitoring solution you can get an end-to-end multi-vendor view of your entire data transport network in a cost-efficient way.
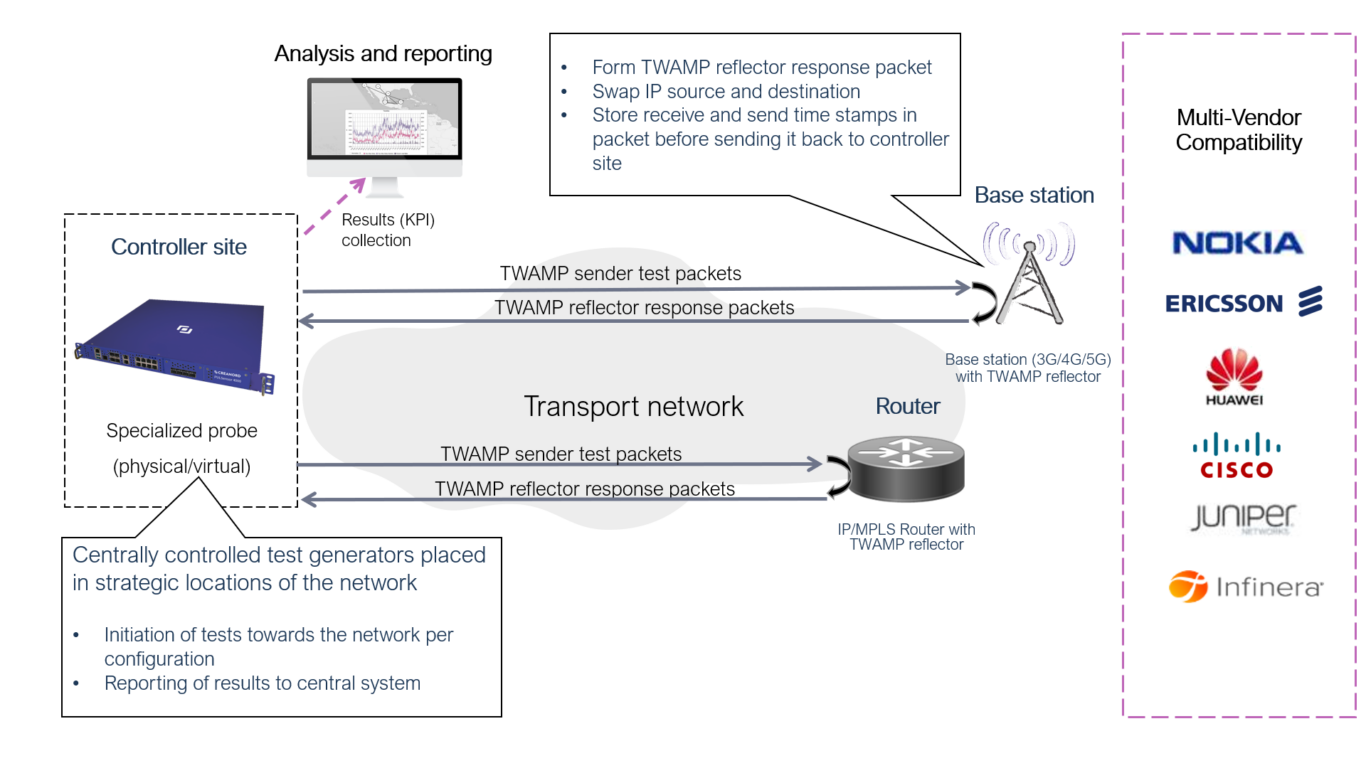
Figure 1 Centralized TWAMP Active Monitoring for 5G Transport Networks
Three Typical Findings from Live Networks
Although TWAMP is fairly widely implemented in networks, operators have not yet reaped the full benefits that it offers. Some are using vendor-provided EMS systems to collect the data with a single-vendor view only and very rudimentary tools for data analysis. Others are using it mainly as an additional end-to-end fault monitoring tool, but without digging deeper into the data and insights that it provides. To highlight some of the additional values provided by the protocol, we have summarized three scenarios that we frequently encounter in the live networks of our customers.
Get a better understanding of a solution for mobile transport performance monitoring
Verify Quality of Service Configurations
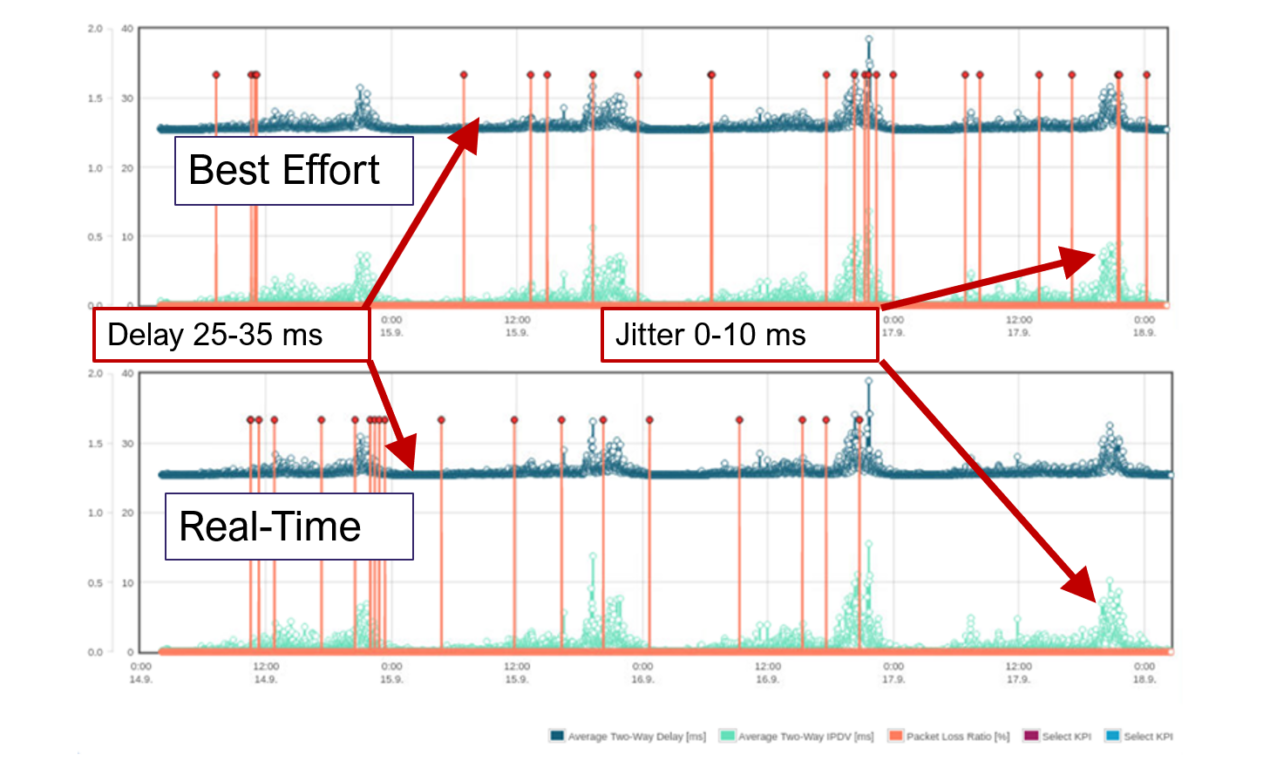
Figure 2 Verify Quality of Service Configurations using KPI Profiles
In the first use case, we look at how the KPI profiles of the measurements can be used to verify that the QoS configurations in the network are correct end-to-end. Configuring all mapping and queueing parameters correctly is challenging and potential configuration errors are very difficult to find. By looking at the KPI profiles of the different service classes in high-load scenarios, you can easily identify if the higher-priority service class is getting prioritized treatment. The above scenario is from a real network where the real-time QoS configuration was incorrect and effectively the real-time and best-effort service classes got similar quality treatment. Normally, these types of configuration errors are difficult to find and result in degraded performance for high-quality and high-revenue services. Using TWAMP to identify and fix the issues proactively ensures that your customers are getting the service quality they pay for from day one.
Identify Route Changes and Re-Engineer the Network
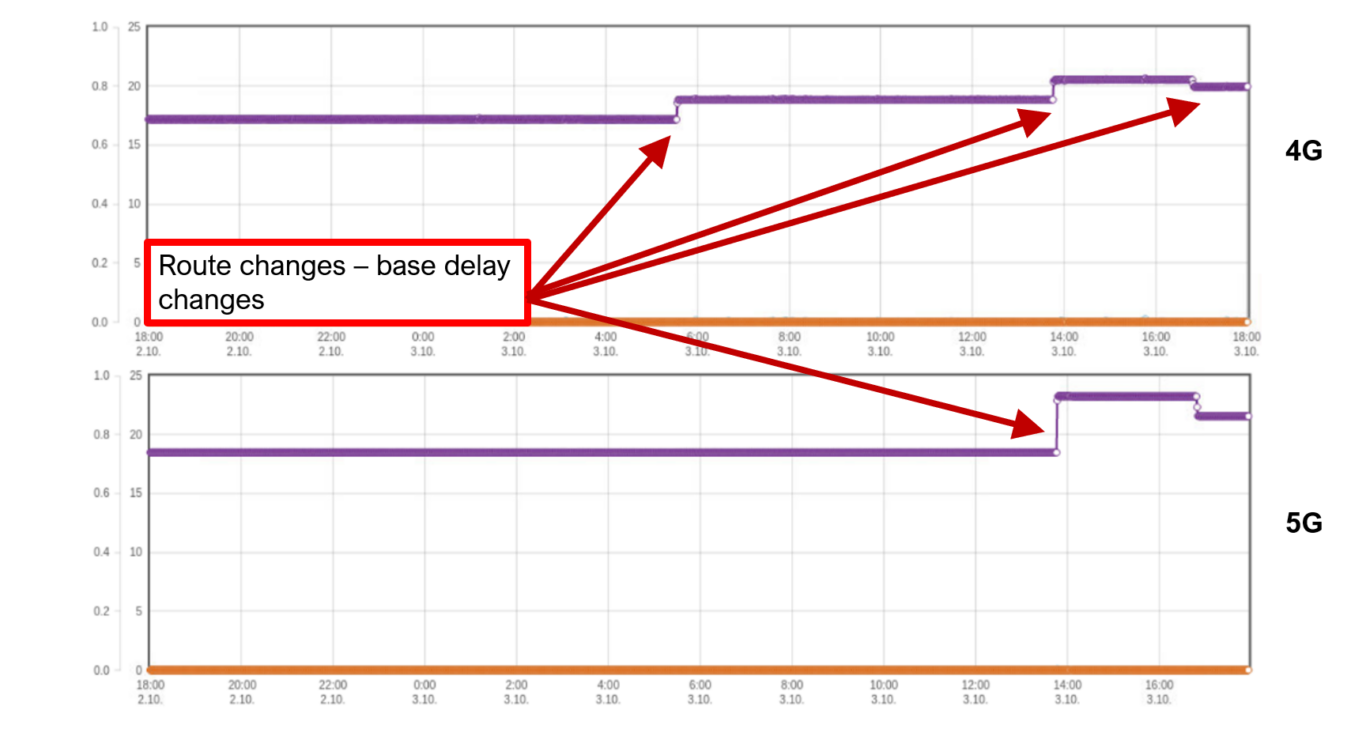
Figure 3 Identify Route Changes from Delay Profiles and Re-Engineer the Network
The second use case looks at how the data can be used to identify route changes and route flapping in the network. By looking at the delay profiles, you can identify jumps in the base delays, many times associated with packet losses that degrade the service quality. The above case from a live network was interesting since the 4G traffic and 5G traffic to the same site clearly followed different paths as base delays were different and route changes occurred at different times for the two traffic types. After identifying this anomaly, the traffic can be re-engineered and routed as intended resulting in better and stable network performance.
Proactive Performance Management
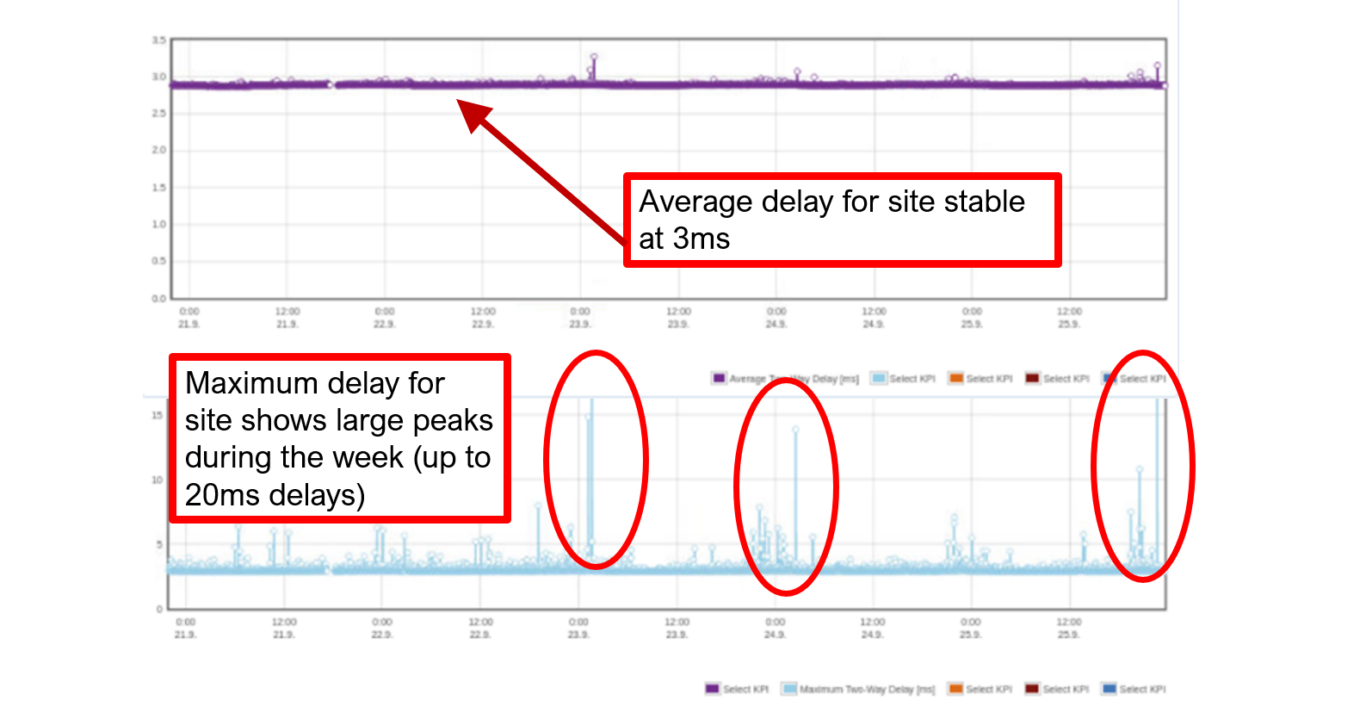
Figure 4 Identify Congested Sites and Fix Capacity Issues Before They Affect Your Customers
In the third use case, we look at proactively identifying sites that are becoming congested in order to add capacity or re-engineer the network before the user experience is affected. By identifying the congested sites, you ensure that you invest in the parts of the network where it matters the most in terms of user experience and service quality.
In the illustration above we see the delay profile for a particular site from one of our customers. The graph above shows the average delays and we can see that it is stable at 3 milliseconds so everything seems to be in order. However, in the graph below we look at the maximum delays for the same site and same time range and see that there are certain times of the day when it can reach up to 20 milliseconds, which already is a fairly large delay considering that we are looking purely at the transport. The site is clearly becoming congested and some of the users may occasionally experience larger delays from micro-bursts in the network. At this point in time, the average delay is not yet affected. Hence, there is still time to fix this capacity issue before the average user experience is affected.
Looking at average delay versus maximum delays (or some suitable percentile) is a great tool to proactively find the spots in the network that are becoming congested and targeting investments to the true bottlenecks in the network.
Conclusions
The TWAMP protocol is the de facto standard for mobile network performance monitoring and is critical as you introduce more and more business and mission-critical services on your 5G network. With a centralized TWAMP approach to performance monitoring you get a multi-vendor view of your entire data transport network in a cost-efficient way. In addition to basic performance monitoring, you can verify network QoS configurations, identify networking issues as well as proactively ensure that you have sufficient capacity across your entire transport infrastructure.
To learn more about how to build modern monitoring capabilities, you can read the mobile transport customer case study from our web site or download our mobile transport performance monitoring solution brief.
Continue reading on the topic. Check out the Mobile transport customer case.
About Creanord
Creanord offers technology solutions for network performance measurements and quality assurance. Driven to turn data into outperforming networks, Creanord helps mobile operators, managed service and wholesale providers as well as critical communications providers to design, offer and deliver services with confidence.
With PULSure, service providers can track network performance and user experience in order to meet the most demanding service needs of their customers.
Since 2000 Creanord has served customers that offer the most demanding networks and applications making societies smarter, businesses more competitive and our lives safer.
Creanord is headquartered in Helsinki, Finland with a global operations and partner network.