Efficient Multi-Vendor Performance Monitoring for Modern Data Networks

Telecommunication networks have always been challenging to manage and that is certainly true for today’s modern data networks. An explosion of video traffic, cloud computing and roll-out of 5G networks introduce a large set of new traffic types with various quality of service requirements on the networks making it more important than ever for Communication Service Providers (CSPs) to be on the pulse of the performance of their networks.
Traditionally, performance management has been link-based with multiple element managers providing details of the performance of the links. Each domain, such as data center, IP/MPLS, radio links, optical and mobile backhaul domains, would have one or several element managers offering their own, vendor-specific view of the performances of the links and ports managed by these element managers. There are multiple challenges for CSPs in such scenario:
- Each element manager offers its own set of counters and reports. Although standards try to harmonize the performance data, each vendor still implements a selected subset of the standards and there are currently no common standard for the format and contents of the actual performance reports across the domains
- Link-based performance monitoring works well for layer 0 (optical) and layer 1 (TDM) but falls short in describing the performance for data layers 2 (typically Ethernet) and 3 (IP). Link-based counters typically include the bandwidth utilization, queue lengths and frame drops, but they are too limited to describe the performance of actual the data services. Data traffic can be very bursty and average bandwidth utilization, for instance,simply does not describe the performance very well
- No end-to-end view of the network performance is available. Identifying links that are congested does not provide an indication on which services or users are affected. Add multiple service classed to the mix and it is nearly impossible to tell anything useful about the service performance (from just the link statistics).
To understand the end-to-end performance, CSPs have traditionally integrated the data from the different element managers through north-bound APIs or by manually consolidating data and CSV files, or alike, produced by the systems. Many man hours are spent weekly to produce individual reports from each domain as well as to consolidate the reports into an end-to-end view that can be shared with operations, planning, and optimization teams and executives. Automating this process by integrating all the element managed into an umbrella solution that would automatically produce these reports are typically multi-year and multi-million dollar projects.
A New Approach to Multi-Vendor End-to-End Performance Management
Fortunately, there is an alternative way to efficiently provide a consolidated, end-to-end view of network performance across multiple vendors and domains. There are three ingredients in the secret sauce: the Two-Way Active Measurement Protocol (TWAMP), specialized probes that measure performance using TWAMP and a performance management system that controls all the measurements, collects the measurement results, and runs analytics, machine learning and AI methods to produce the needed consolidated reports for the different user groups.
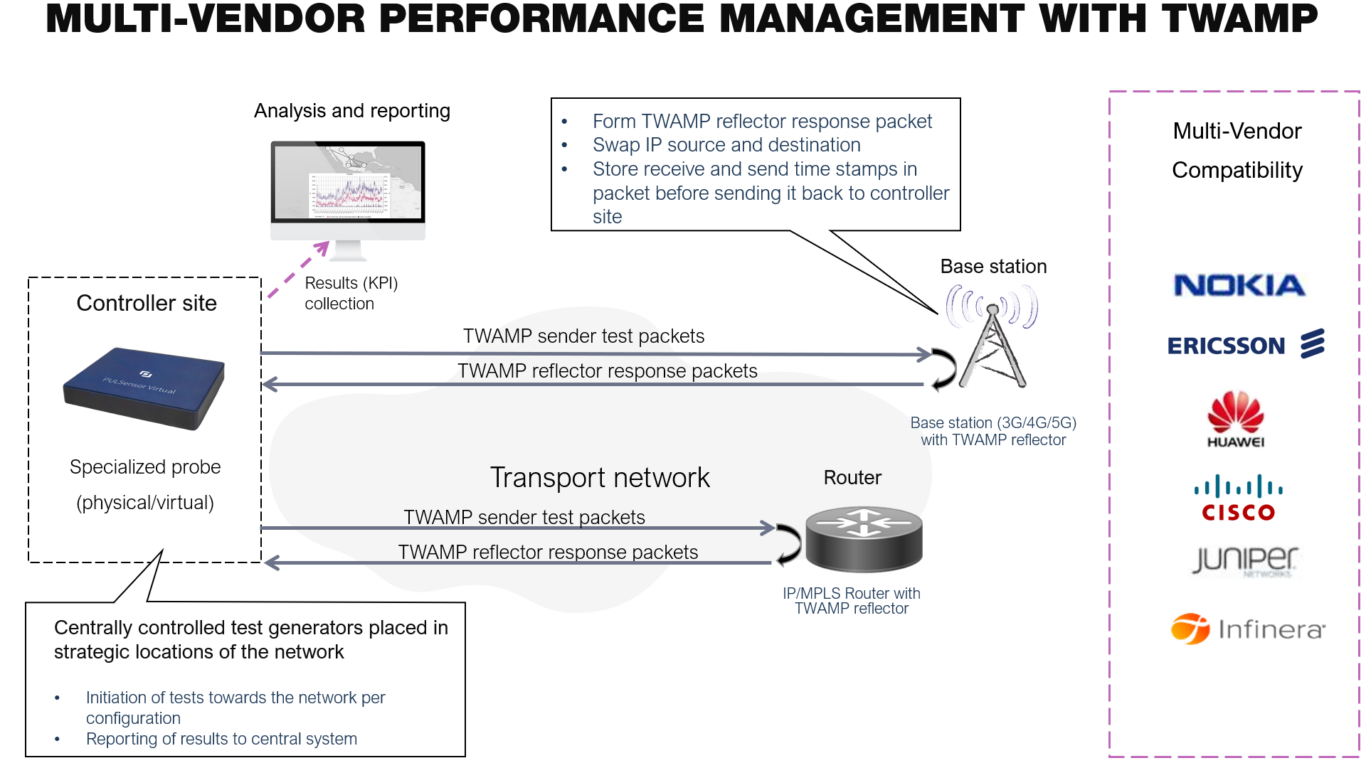
Figure 1 Using TWAMP for Multi-Vendor Performance Management
TWAMP was standardized in 2008 and has gradually been implemented in network equipment over the years. Today, most of the devices support the TWAMP protocol. Using specialized probes to initiate and receive the TWAMP test packets and third-party devices to reflect the packets guarantee that the actual performance reports and analytics are always calculated in the same way regardless of the third-party device being tested. The third-party device only needs to reflect the TWAMP test packet back with time stamps on receive and send times. No further business logic is implemented in the third party. All advanced data collection and analysis is done in the specialized probes and management system and since a single system is used for the reporting, all reports are harmonized and accurate.
Cost-Efficient Deployment
Intuitively it might feel that deploying another system into the OSS stack for end-to-end, multi-vendor performance management is costly and takes a long time to implement. However, it is, in fact, the opposite. A single, specialized probe can handle thousands of test targets and therefore you only need to deploy a few of them in centralized locations to provide a full view of the entire network performance across the different vendors. If preferred, you may also run the probes virtually to even avoid installing these few physical boxes. No further installation work is needed across the network, you only need to activate the TWAMP reflector functionality in all the devices towards which you want to measure.
To provide one real-life example, a customer in Asia was able to monitor 15.000 targets roughly divided into 10.000 base stations and 5.000 routers and other networking devices with only five specialized probes installed at central locations in the network. And this case involved monitoring three different service classes for each target and across three different base station vendors and one transport network vendor. Deploying the entire solution took less than a month as all information could be automatically imported into the system based on consolidated information from the inventory system. An impressive timeline for achieving performance monitoring in a very large multi-vendor network.
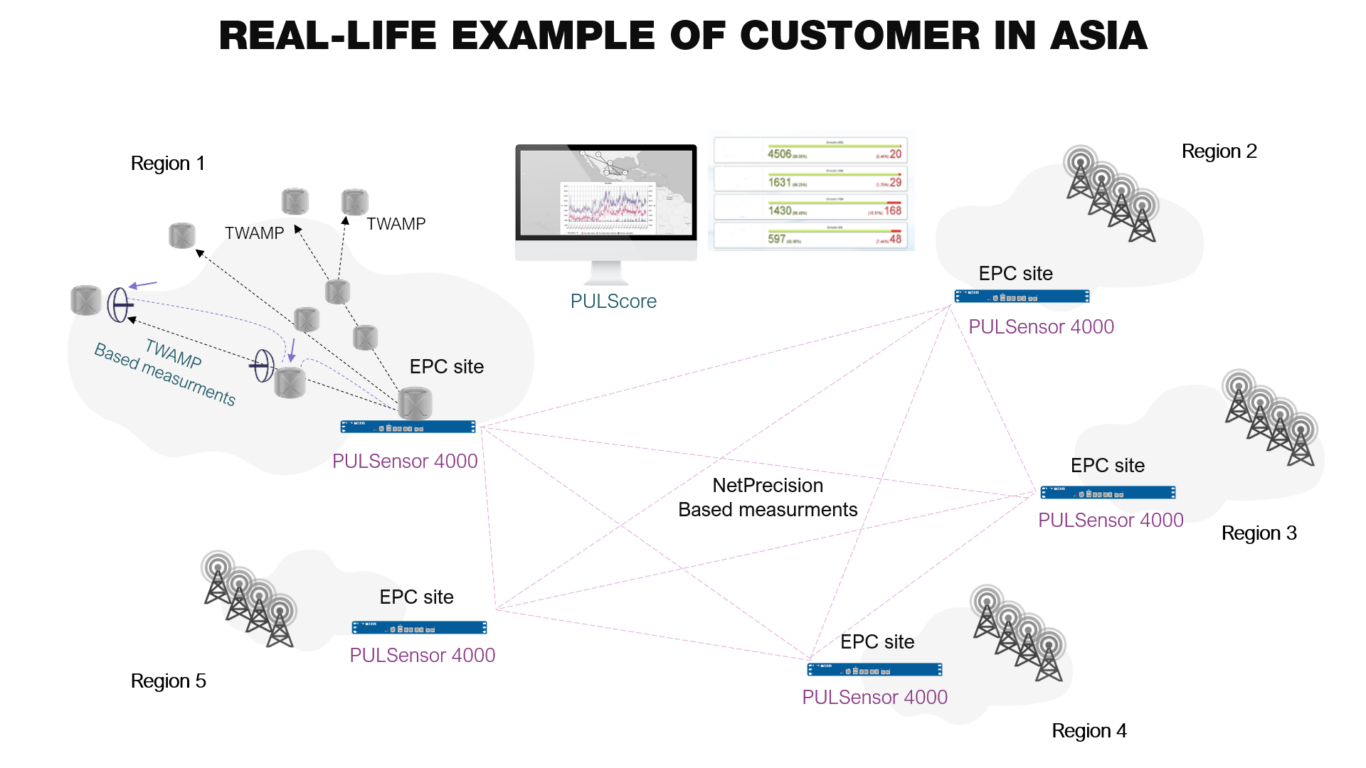
Figure 2 Real-Life Example of Multi-Vendor Performance Management from a Customer in Asia
Conclusions
In this blog a new approach to multi-vendor performance monitoring was described. Rather than integrating multiple element management systems into an umbrella performance management solution, an approach was described where you deploy centralized probes at a few central locations and monitor the entire network performance using the standardized TWAMP protocol in order to achieve interoperability. This approach has the following benefits:
- Harmonized view: Specialized probes are in charge of the performance monitoring for all different domains in the network and thus the analytics, machine learning and reports are applied to a consistent set of data regardless of the vendors. Monitored devices only need to implement simple TWAMP reflector functionality, which is available today in most of the network devices. All specialized logic and analysis is done in the specialized probes and the performance management system, guaranteeing a harmonized set of results across different vendors.
- Accurate and trustworthy data: The third-party devices only need to implement reflector functionality, which basically is to record and insert receive and send time stamps, swap UDP and IP information, and send the packet back to the originator. This is easy to implement in the third party devices and processing of the timestamps and further analysis and calculation of key performance indicators (KPIs) is handled by the specialized probes. The approach provides accurate and consistent data across the different device families compared to calculating the KPIs separately in each network device.
- Cost-efficient: To monitor a very large network, you only need to deploy a few specialized probes in central locations and even these nodes could be run virtually in a data center when applicable. Other than that, you only need to enable the reflector functionality in the monitored devices, which is something that can be done remotely, thus avoiding a large amount of site visits. Interoperability is given and no further element manager integrations need to be implemented, guaranteeing a quick and effortless deployment of the solution.
To learn more about how to build modern monitoring capabilities, read the mobile transport customer case study from our web site or download our Mobile transport performance monitoring solution brief.
Do you want to know more on the value of TWAMP monitoring? Continue reading about typical Findings in live networks
About Creanord
Creanord is a specialist in service assurance with more than 20 years of experience in developing solutions for communications service providers. Creanord’s service assurance solutions enable accurate tracking of network and application performance and quality. Our technology has been implemented in over 30 countries and more than 60 networks globally.
Find out more on how we can help you build outperforming networks by reaching out to us here.