Advanced TWAMP Monitoring Techniques for Modern Data Networks

In earlier blogs in this series we have introduced the Two-Way Active Measurement Protocol (TWAMP) for active performance monitoring of 5G transport networks and looked at some concrete findings that we have found in live networks with our customers. In this blog, we will look at some more advanced monitoring techniques that you can use to further improve the visibility into the network performance, solve tricky troubleshooting issues as well as ensure excellent voice services for your customers.
In today’s competitive telco landscape, providing an excellent network experience to the users is key to win new business and hold on to existing customers. Studies show that the top buying factor for 40% of the users is the network and similarly the users will switch operators because of network quality issues in 40% of the cases. With 5G, there are more use cases for mission critical and business critical traffic on the networks such as the transition from TETRA to mission critical broadband networks based on 4G/5G networks and a MOCN model. These types of networks demand excellent network performance at all times.
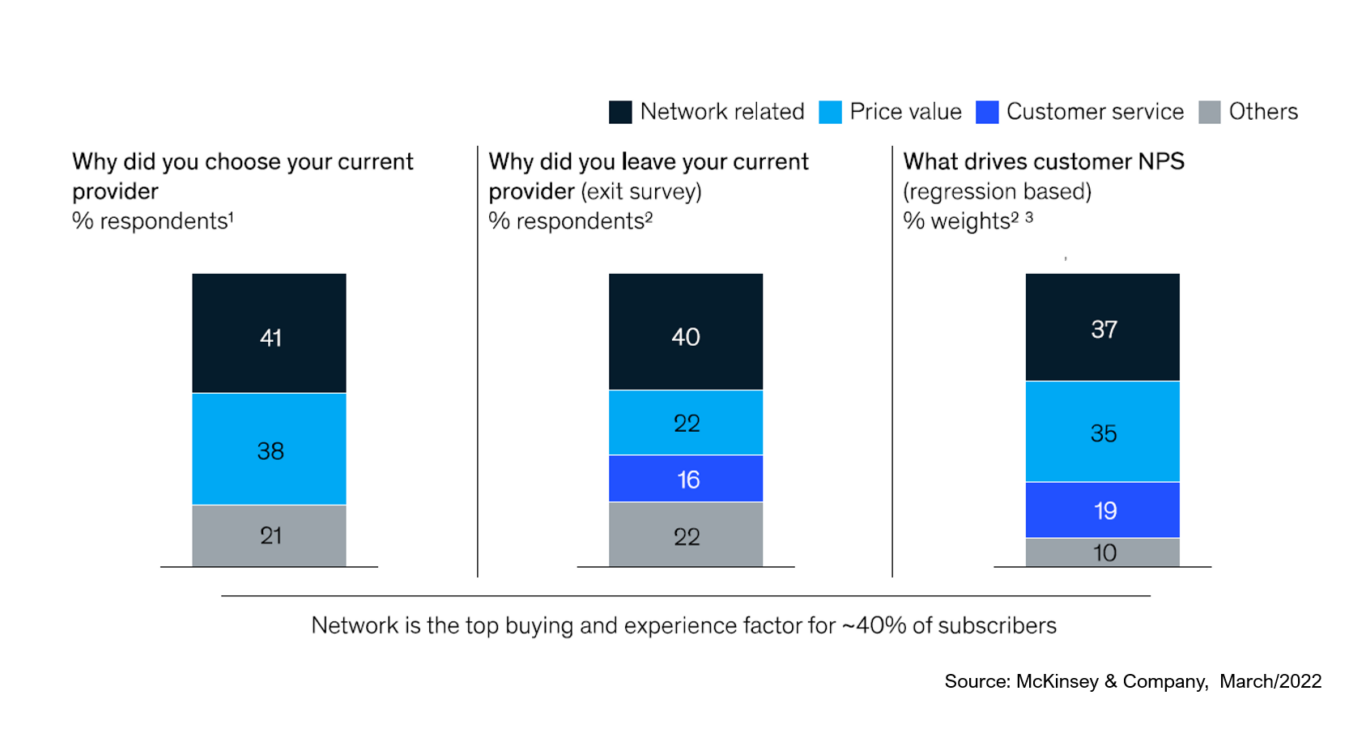
Figure 1 Network Experience is Key to Win New Business and Hold on to the Existing Customer Base
TWAMP is the de facto protocol for monitoring data networks. The protocol has been designed for providing sufficient granularity and accuracy to measure microbursts present in modern networks and is widely supported by the major network element vendors. By deploying a centralized TWAMP monitoring solution you get an end-to-end multi-vendor view of your entire data transport network in a cost-efficient way.
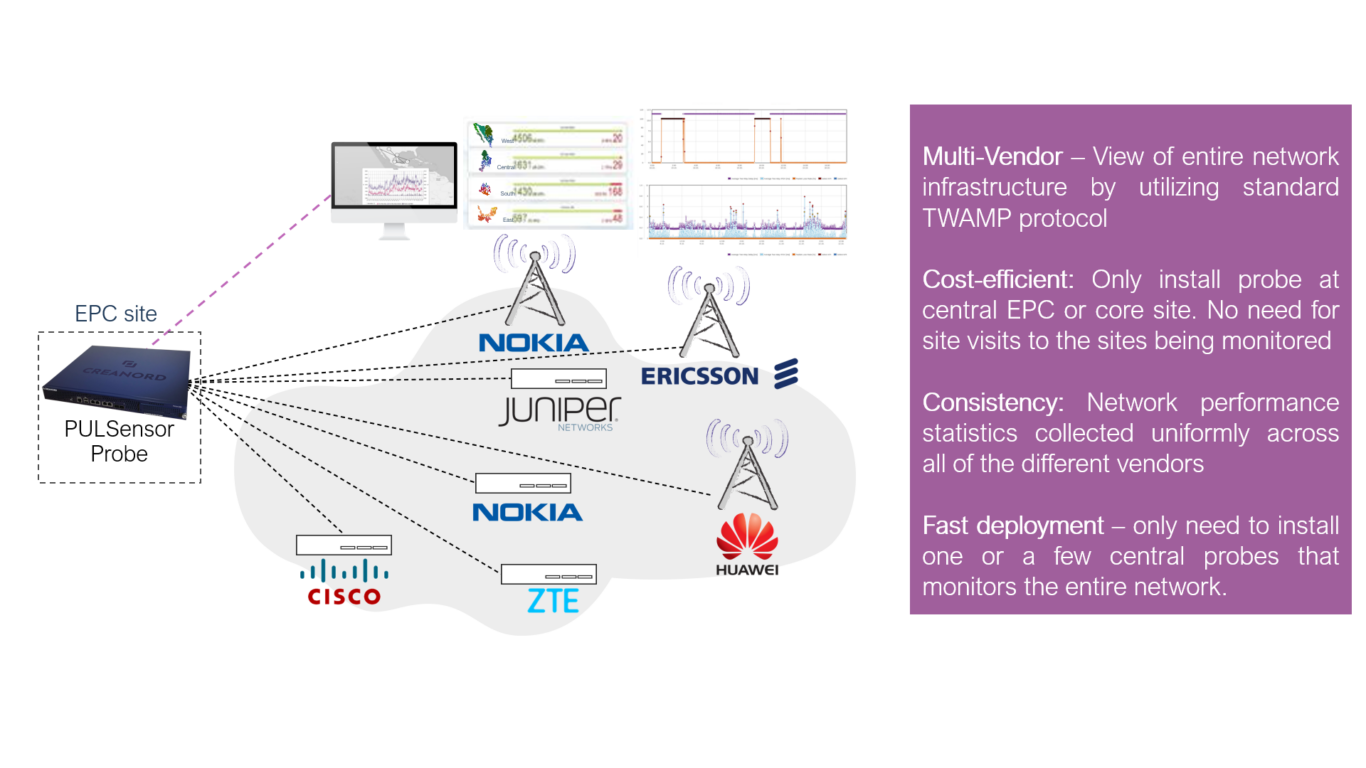
Figure 2 Multi-Vendor View Across the Entire Data Transport Network with Centralized TWAMP Active Monitoring
Today we look at three advanced use cases for TWAMP monitoring:
- How to increase visibility with link aggregation and equal cost multi-path monitoring
- How to efficiently troubleshoot QoS configuration issues
- How to measure the user experience of the network using mean opinion scores
 Do you want to understand TWAMP protocol better? Read this article:
Increasing Visibility with Link Aggregation and Equal-Cost Multi-Path Monitoring
In the first use case we look at monitoring link aggregation (LAG) and equal-cost multi-paths (ECMP). Here the issue is that normally when you monitor it with TWAMP or some other active measurement, the packets will always traverse through the same link aggregation member or equal-cost path. Thus, if there are issues with some other member in the group or some other equal-cost path, you will not see those issues as all test packets go through only one path.
However, it is possible to introduce entropy into the test traffic in order to ensure that all possible component links and equal-cost paths are traversed at some point. Combined with advanced reporting, the introduced entropy ensures that you have full visibility into the performance of each individual member and path in the network.
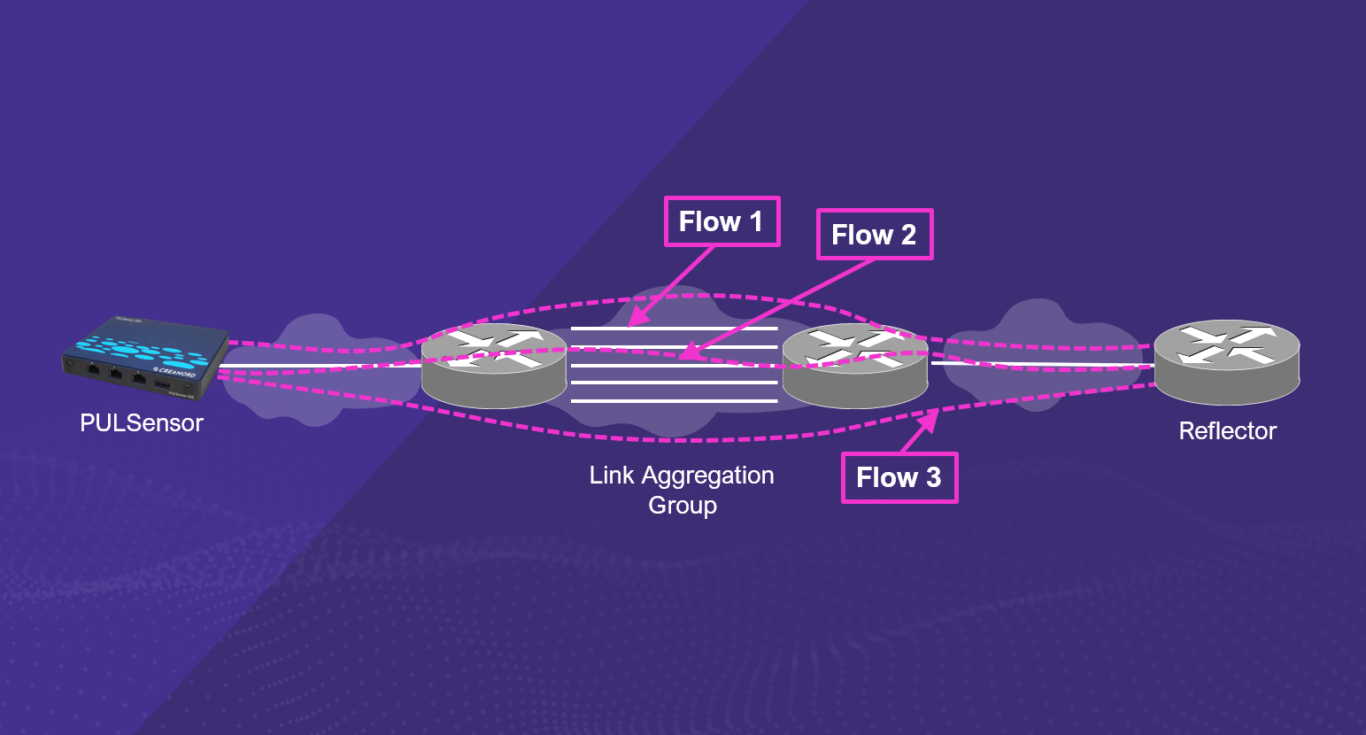
Figure 3 Increased Visibility with Link Aggregation and Equal Cost Multi-Path Monitoring
Efficient troubleshooting of QoS Configuration Issues
In the second use case, we look at how we can efficiently find QoS configuration issues in the network end-to-end with the TWAMP protocol. When the testing probe sends out a TWAMP packet, it will put a so-called differentiated services code point (DSCP) value in the IP packet to identify what type of QoS treatment the packet should get from the network. This code value is mapped to other network layers depending on the forwarding used such as mapping it to VLAN Priority bits in case of layer 2 switching or mapping it to MPLS EXP bits in case of MPLS networks. This ensures that the traffic is getting prioritized treatment end-to-end. Depending on the network configuration, this priority value may be copied back to the DSCP field at the other end of the forwarding path. Sometimes the mappings are not correctly configured and the wrong DSCP value is returned. By monitoring the received DSCP value and comparing with the originally sent DSCP value, the testing probe may identify if the network incorrectly changed the DSCP value and may thus identify QoS configuration issues.
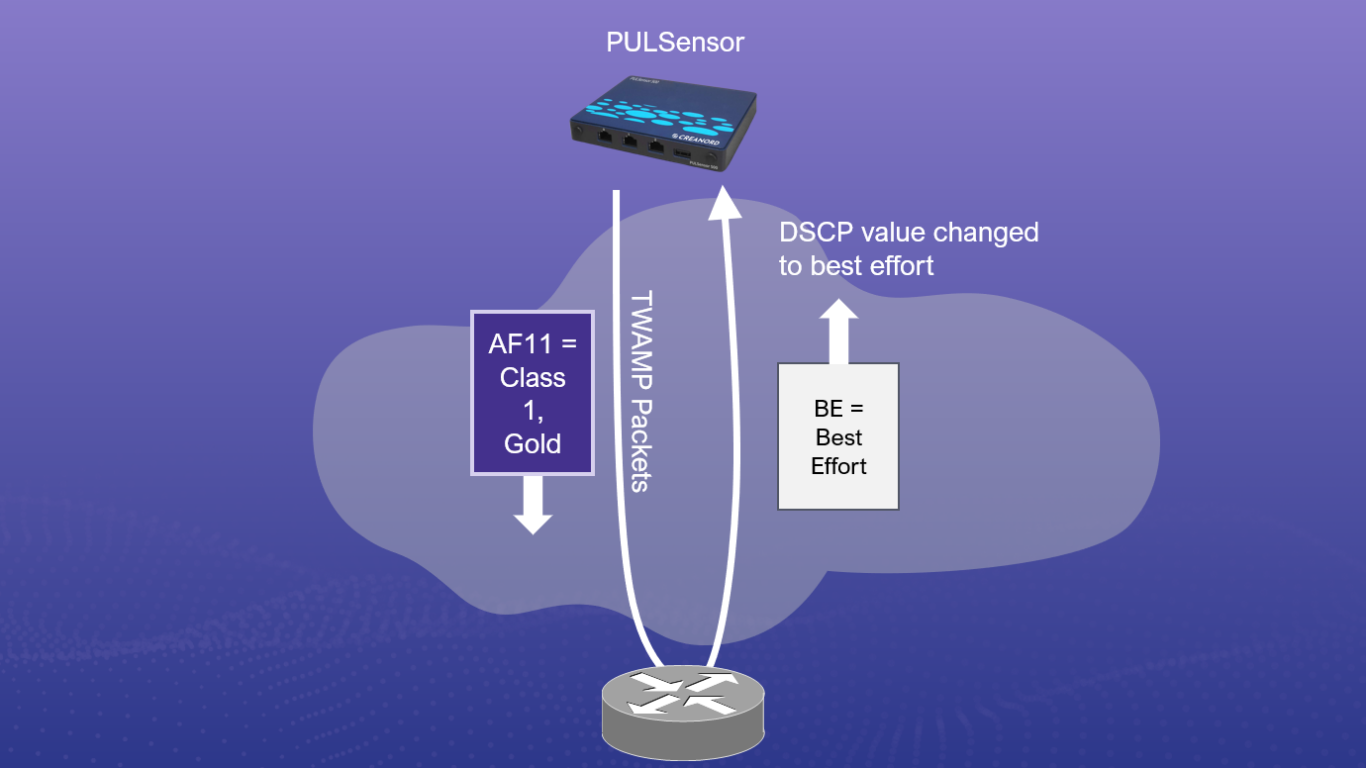
Figure 4 Monitoring Differentiated Services Code Point Changes
Measuring the User Experience of the Network Using Mean Opinion Scores
In the final use case we look at measuring the user experience in terms of voice traffic on the network. Voice is still a critical service for many users including business users, mission critical users and other high average revenue per user (ARPU) customers. Understanding how they experience the voice quality is critical to protect the revenue from these customers.
The ITU-T defined E-model can be used to calculate a mean opinion score (MOS) from the KPIs produced by the TWAMP measurement. The model takes some additional inputs such as codec used, jitter buffer sizes etc and then calculates a MOS score on a scale from 1 to 5. Above the score 4, the service is good and below 3 it is really bad. Ensuring that the score is above 4 consistently around the network ensures that the users are receiving a good voice service and protects the revenues from these high-ARPU segments.
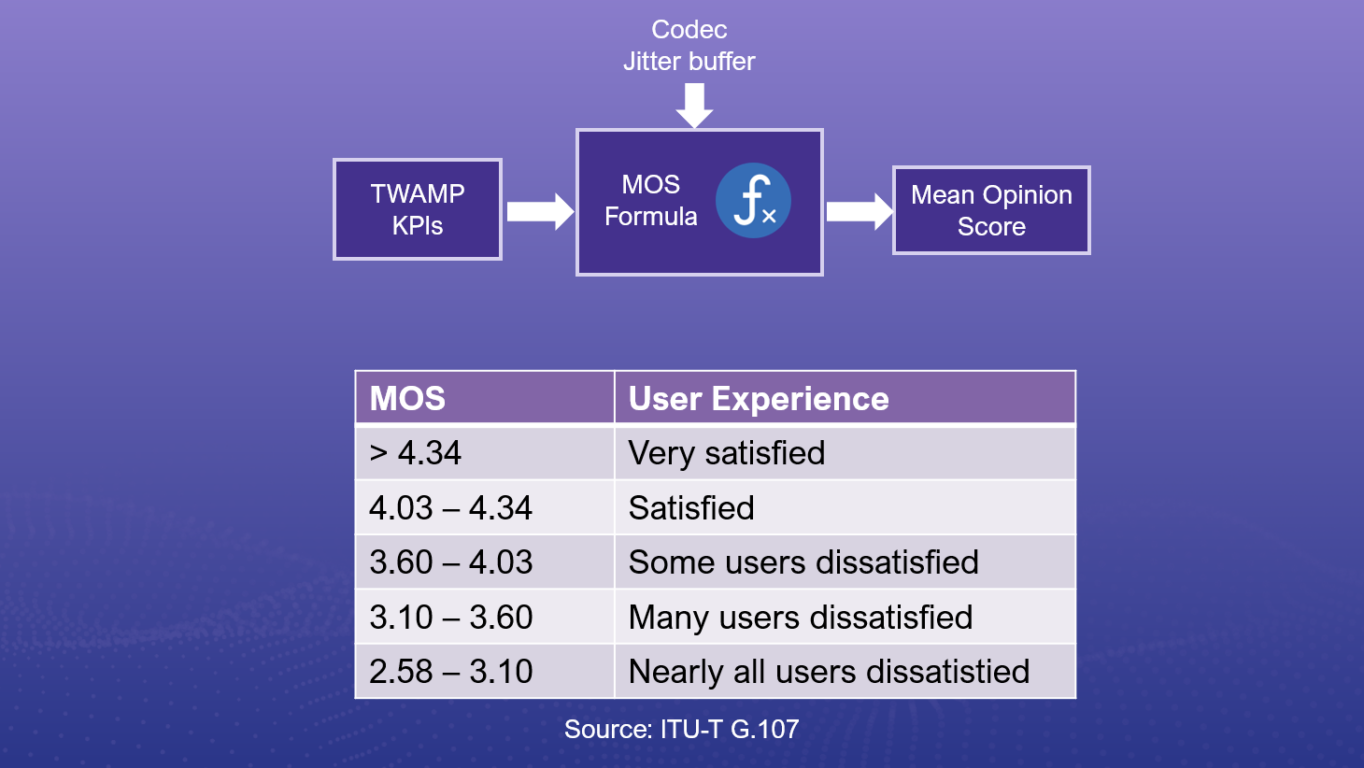
Figure 5 Ensuring Consistent Voice User Experience with MOS
 Get the 5G context, watch the webinar:
Conclusions
With a centralized TWAMP approach to performance monitoring you get a multi-vendor view of your entire data transport network in a cost-efficient way. In addition to basic performance monitoring, there are several more advanced ways that you can use TWAMP to build an outperforming data transport network. Three of these options were covered in this blog.
To learn more about how to build modern monitoring capabilities, you can read the mobile transport customer case study from our web site or download our mobile transport performance monitoring solution brief.
Get a better understanding of a solution for mobile transport performance monitoring
About Creanord
Creanord offers technology solutions for network performance measurements and quality assurance. Driven to turn data into outperforming networks, Creanord helps mobile operators, managed service and wholesale providers as well as critical communications providers to design, offer and deliver services with confidence.
With PULSure, service providers can track network performance and user experience in order to meet the most demanding service needs of their customers.
Since 2000 Creanord has served customers that offer the most demanding networks and applications making societies smarter, businesses more competitive and our lives safer.
Creanord is headquartered in Helsinki, Finland with a global operations and partner network.